Mean Sea Level
The traditional way of referring depth information in Swedish charts is by specifying a mean sea level for a given year (typically the chart production year).

The traditional way of referring depth information in Swedish charts is by specifying a mean sea level for a given year (typically the chart production year). However, since the majority of the Swedish coast has a continuous land uplift, depth information in these areas gradually becomes obsolete. Uplift entails that both land and the seabed rises relative to the ocean surface as a result of having been depressed by the weight of the ice sheet during the last ice age. The uplift is greatest in northern Sweden, where it is about 1 cm/year.
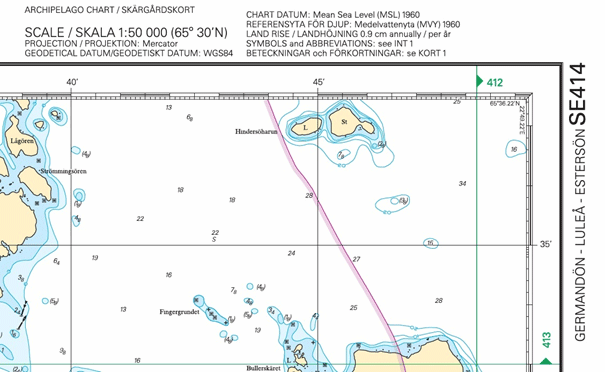
As a consequence, both uplift and current sea level can be important for calculating the current depth. Each printed chart gives information about the rate of land uplift as well as the year the mean sea level relates to. This can be found to the right in the upper margin of the chart. Using this information, it is possible to recalculate the chart depths to the current year's mean sea level and subsequently adjust for the current sea level to retrieve the current depth.
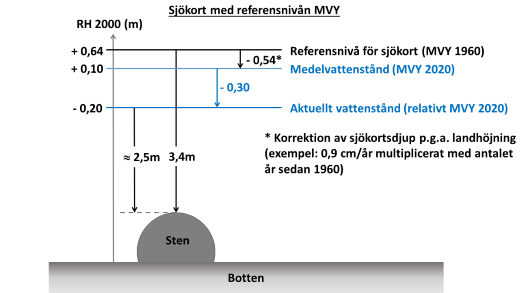
Example: Chart 4151 indicates a depth of 3.4m for a shoal and the current water level is -30 cm in relation to the current year's mean sea level. The chart indicates that its datum is the mean sea level in 1960 and that the rate of land uplift is 0.9 cm per year. This means that year 2020, the land-uplift correction will be (2020 - 1960) x 0.9 ≈ 54 cm. Therefore, depth values in the charts need to be reduced by about 0.5m due to land uplift. If you also take the current sea level into account (in the example -30 cm), the current depth (in meters) for the shoal becomes 3.4 - 0.54 -0.30 ≈ 2.5 m, see the diagram below.

NOTE! The example is designed to demonstrate an extreme case in the Gulf of Bothnia, where the land uplift is greatest, but since the Swedish Maritime Administration is working to introduce a new reference level in Swedish charts and started this work where the consequences are greatest, the current edition of chart 4151 is related to the new the reference level, the Baltic Sea Chart Datum 2000. See also the attached links on Reference Levels.
See adjacent links for information and data about the current sea level and the current year's mean sea level.
Last updated 2021-08-11